
Database metrics
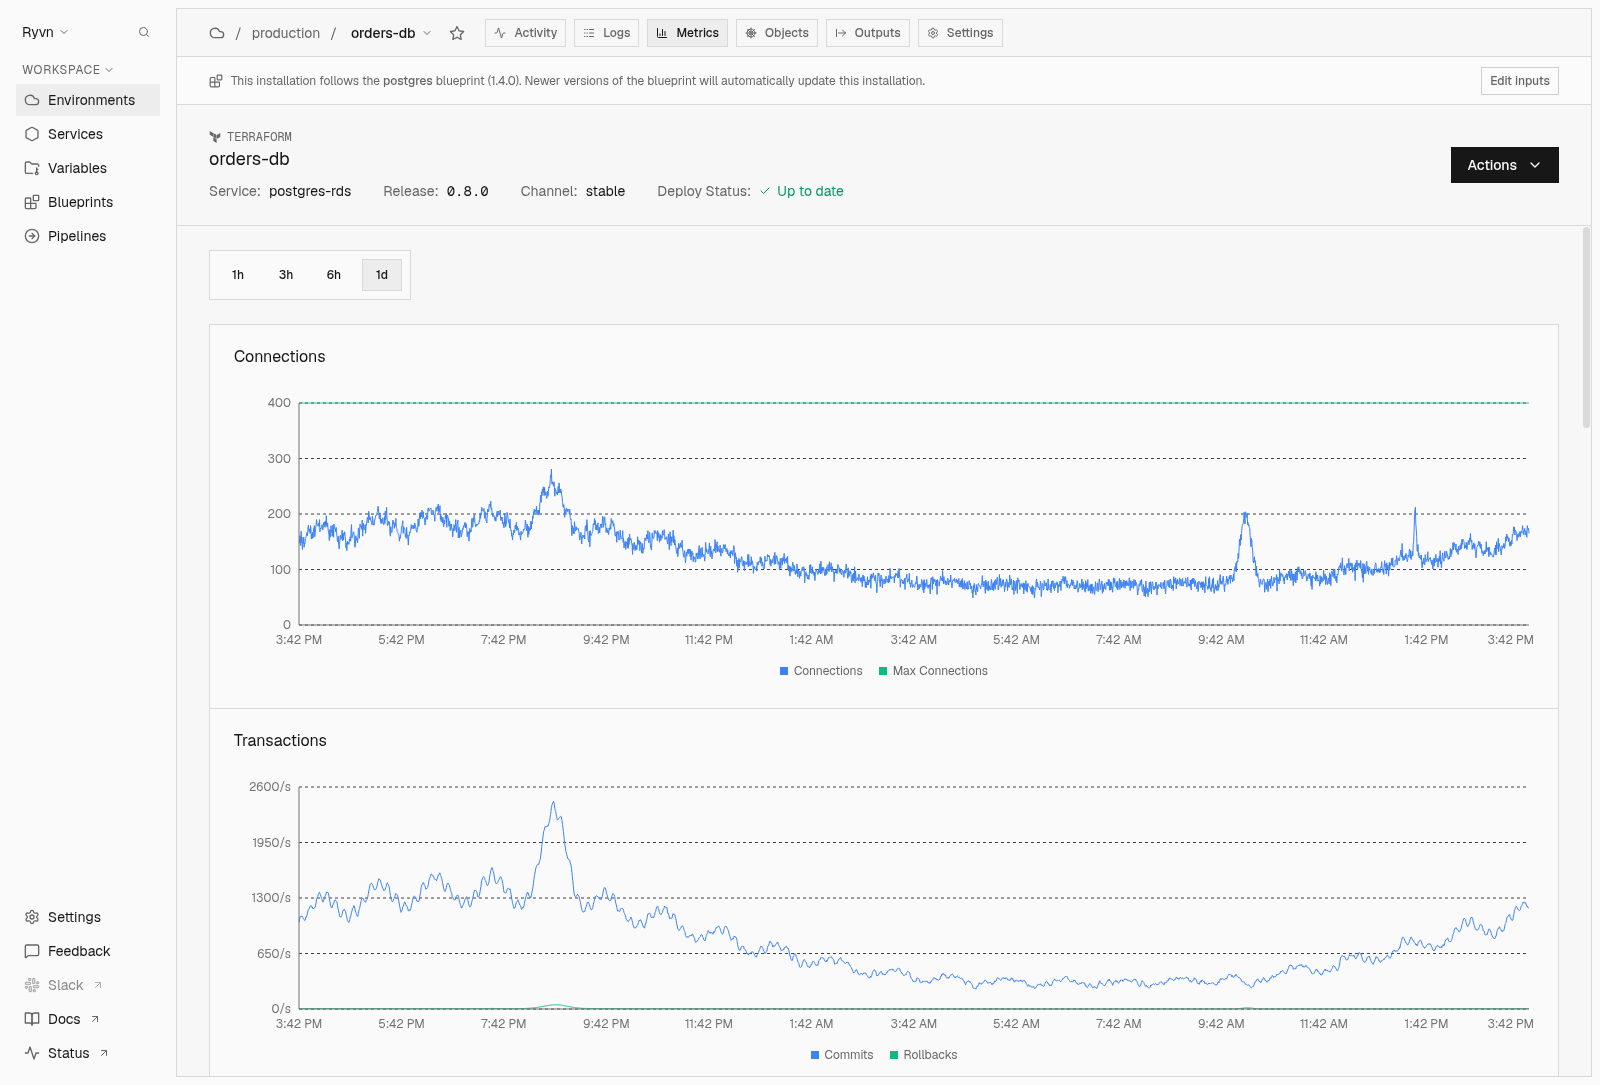
Your managed Postgres installations now show engine metrics in the Metrics tab: connections against the server limit, commits and rollbacks, active queries, rows read and written, cache hit ratio, deadlocks, longest running transaction, database size, and WAL growth. You can see a connection pool filling up, a stuck transaction, or a database growing faster than expected next to the services that talk to the database, without opening the cloud console. The postgres blueprint collects them by default on Amazon RDS, Cloud SQL, and Azure Flexible Server through a monitoring role that reads statistics and never your data, and the same series are available in Grafana.